2021 Production Loss – Wake Forest
I am doing the ACC non-Pitt opponents in alphabetical order. That means Wake Forest. The next article starts the Pitt 2022 opponents.
Dave Clawson took over the head coaching duties prior to the 2014 season. His record over time is 51 – 48 (26 – 37 Conference, 21 – 8 OOC, 0 – 1 conference championships, and 4 – 2 Bowls.
I do give the Wake admin credit for sticking with him. It paid off with a division title and a 11 win season. Only the second in Wake Forest history (2006).
Wake is one of three teams most likely to take the Atlantic. Will they repeat?
All that leads us to last year results and the upcoming 2022 schedule.

Another team that knows how to schedule OOC games. Besides the NCAA rule change that allows a conference to decide who plays in the conference championship, the 2019 and 2021 out of conference matchups between Wake and UNC were made to shorten the 6/7 year wait between conference games.
Does Wake dropping 70 on Army count as running up the points per game average? Or does beating an FCS team only count? And with Army scoring 56, should we adjust Wake’s points allowed per game down? I want to know the rules.
Here are the Rivals 5.6 and above 2022 commits. Also included is the current Transfer Portal (TP) additions.

As you know, I like to use color coding to highlight certain items – light blue for eligibility, reddish pink for TP entries and a bright green for medical, grades or disciplinary reasons. Wake has a commit who would be a bright green for still being a verbal if I showed Rivals 5.2 2-stars.
A Richmond Spider TP signee. Does our resident authority on Spider basketball follow or know about the Spider football team?
Wake has lost 10 scholarship players to the TP this year – Three from the offense, seven from the defense.
On to the stars identified as NCAA team leaders in selected stats or members of the All ACC teams.
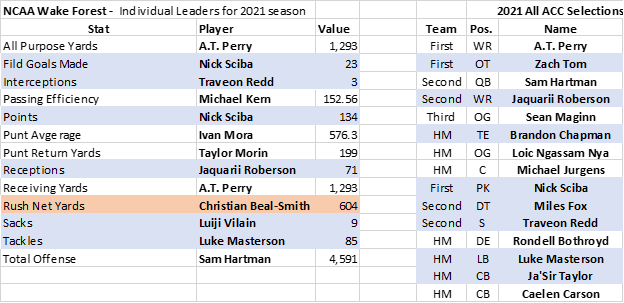
That is a lot of color. Can we be having a taste of production loss.
The offense revolves around QB play. I have added sacked and yards lost to the QB chart.

Another team with limited backup QB snaps. I believe Kelly is a walk on. Wake did sign a QB in the 2022 class – Brett Griffis. Same last name as the Griffis in above chart. Brother? Cousin? Coincidence?
NC State running backs and receivers 2021 activity. Also returning production for the first four teams reviewed.
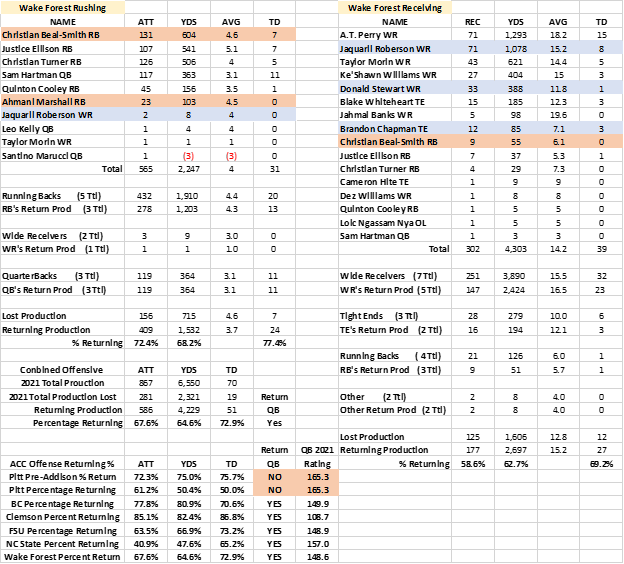
Just based on returning production of the five Atlantic teams, Wake looks as a potential third place team. But Boston College is nipping at their heels.
Can the Oline stats shake the Eagles and move Wake back into contention?
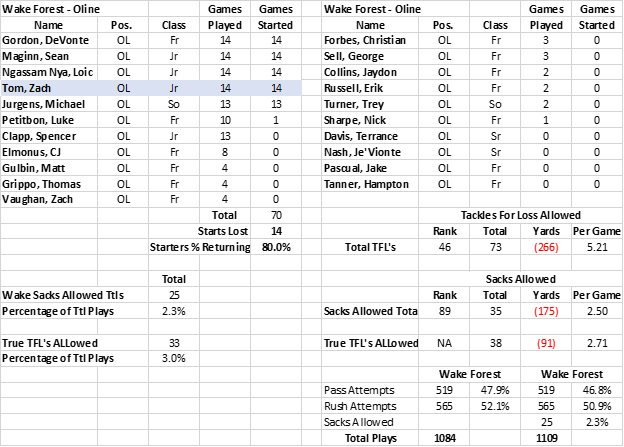
Lost just one starter – Zack Tom. First team All ACC and a fourth round pick in the NFL draft. But they may have replacements just based on games played.
This is where I really need snap counts to judge potential starters. It is one thing to say a player had action in 13 game. But were they all on special teams?
As an aside, the one player who had one start is identified as a freshman. I get my data from the NCAA Wake Forest roster. The problem is that this particular player could be a TRUE freshman, a redshirt freshman or a Covid year freshman. (Petitbon was a 2020 recruit). Pickett was identified as a senior.
Actually, Wake had a solid Oline allowing 25 sacks (2.3%) and 33 TFL’s (3.0%) on 1,084 offensive plays.
Another aside. Pitt had 5 sacks in the championship game. That is 20% of the total times Hartman was sacked. Clemson had 7 (28%). NC State had 3 (12%).
That wraps up the NC State Offense. On to the defensive review.
Wake had 50 players make a defensive stat. But eleven of them were offense players. One was a special teams players. That leaves 38 defensive players making a stat.
The chart below strips out the non-defensive players and twelve players who did not make at least double digit tackles. (By now you have learned I use a lot of copy and paste and change a few stats. That is what happens when you have boilerplate.)

I struggled with Wake’s defense (and the other five team reviewed. What to say? What is important? It has been trial and error. Started with anyone who had a defensive stat. Winnowed out the offensive /special team players. Color coded the eligibility and TP players. Sorted by defensive group (DB, DL, and LB). Only then did I summarize totals and defensive groups.
I then decided. I had to cull the number in the chart. I decided ten total tackles was the number to use. Why, you ask? That goes back to the “two-deep” roster – twenty two. (I have lowered below ten tackles to reach at least twenty players.)
I then added a total line just for those players on the chart. I have now added a line breaking down the players listed between returning and those who have left.
Based on total tackles, Wake has the lowest returning percentage of those teams reviewed. But they have 18 players returning with considerable experience.
As I said earlier, Wake looks like the third-place team in the Atlantic. That wraps it up. Next, West Virginia.
